Debugging Transaction is not Active

Problems like this happen occasionally and are quite bedeviling.

Caused by: java.lang.RuntimeException: CONTAINER:atg.repository.RepositoryException; SOURCE:org.jboss.util.NestedSQLException: Transaction is not active: tx=TransactionImple < ac, BasicAction: 7f000001:c525:503e32fb:2f2c status: ActionStatus.ABORT_ONLY >; - nested throwable: (javax.resource.ResourceException: Transaction is not active: tx=TransactionImple < ac, BasicAction: 7f000001:c525:503e32fb:2f2c status: ActionStatus.ABORT_ONLY >)
    at atg.adapter.gsa.GSAItemDescriptor.loadProperty(GSAItemDescriptor.java:5479)
    at atg.adapter.gsa.GSAItem.getPersistentPropertyValue(GSAItem.java:1101)
    at atg.adapter.gsa.GSAItem.getPropertyValue(GSAItem.java:994)
    at atg.adapter.gsa.GSAItem.getPropertyValue(GSAItem.java:1272)
    at atg.repository.RepositoryItemImpl.getPropertyValue(RepositoryItemImpl.java:128)
    at atg.commerce.order.processor.ProcLoadHandlingInstructionObjects.runProcess(ProcLoadHandlingInstructionObjects.java:183)
    at atg.service.pipeline.PipelineLink.runProcess(PipelineLink.java:233)
    at atg.service.pipeline.PipelineChain.runProcess(PipelineChain.java:343)
    ... 17 more
Caused by: CONTAINER:atg.repository.RepositoryException; SOURCE:org.jboss.util.NestedSQLException: Transaction is not active: tx=TransactionImple < ac, BasicAction: 7f000001:c525:503e32fb:2f2c status: ActionStatus.ABORT_ONLY >; - nested throwable: (javax.resource.ResourceException: Transaction is not active: tx=TransactionImple < ac, BasicAction: 7f000001:c525:503e32fb:2f2c status: ActionStatus.ABORT_ONLY >)
    at atg.adapter.gsa.GSAItemDescriptor.loadProperties(GSAItemDescriptor.java:5431)
    at atg.adapter.gsa.GSAItemDescriptor.loadProperty(GSAItemDescriptor.java:5471)
    ... 24 more
Caused by: org.jboss.util.NestedSQLException: Transaction is not active: tx=TransactionImple < ac, BasicAction: 7f000001:c525:503e32fb:2f2c status: ActionStatus.ABORT_ONLY >; - nested throwable: (javax.resource.ResourceException: Transaction is not active: tx=TransactionImple < ac, BasicAction: 7f000001:c525:503e32fb:2f2c status: ActionStatus.ABORT_ONLY >)
    at org.jboss.resource.adapter.jdbc.WrapperDataSource.getConnection(WrapperDataSource.java:96)
    at atg.service.jdbc.WatcherDataSource.getConnection(WatcherDataSource.java:801)
    at atg.service.jdbc.WatcherDataSource.getConnection(WatcherDataSource.java:782)
    at atg.adapter.gsa.GSATransaction.getConnection(GSATransaction.java:744)
    at atg.adapter.gsa.GSAItemDescriptor.getConnection(GSAItemDescriptor.java:2365)
    at atg.adapter.gsa.GSAItemDescriptor.loadProperties(GSAItemDescriptor.java:5345)
    ... 25 more
Caused by: javax.resource.ResourceException: Transaction is not active: tx=TransactionImple < ac, BasicAction: 7f000001:c525:503e32fb:2f2c status: ActionStatus.ABORT_ONLY >
    at org.jboss.resource.connectionmanager.TxConnectionManager.getManagedConnection(TxConnectionManager.java:319)
    at org.jboss.resource.connectionmanager.BaseConnectionManager2.allocateConnection(BaseConnectionManager2.java:403)
    at org.jboss.resource.connectionmanager.BaseConnectionManager2$ConnectionManagerProxy.allocateConnection(BaseConnectionManager2.java:850)
    at org.jboss.resource.adapter.jdbc.WrapperDataSource.getConnection(WrapperDataSource.java:90)
    ... 30 more

I tweeted about issues like this over two years ago.

As I said in the tweet this almost always is not a transaction issue but actually an application issue. The tweet references an excellent article Transaction is not active: tx=TransactionImple < ac, BasicAction in which the author found in his case that the problem was a NullPointerException which caused the transaction to end.

Today I had to debug this issue again. First I checked the transaction in ProcLoadHandlingInstructionObjects before it called getPropertyValue on the shipping group repository item.

GSAItem item = (GSAItem) sgMutItem;
ItemTransactionState state = item.getItemTransactionState(false);
logDebug("state=" + state.mGSATransaction);

I saw in the logs that the status of the transaction was ActionStatus.ABORT_ONLY which meant the transaction was already aborted before getting the property value from the repository which is why the Transaction is not active exception happened.

Next I checked the transaction at the beginning of ProcLoadHandlingInstructionObjects using the order repository item.

GSAItem item = (GSAItem) orderItem;
ItemTransactionState state = item.getItemTransactionState(false);
logDebug("state=" + state.mGSATransaction);

When I confirmed that the status of the transaction was ActionStatus.ABORT_ONLY at the beginning of the processor I went backwards through the pipeline checking all the processors in the same way.

After doing that and confirming the transaction was ActionStatus.ABORT_ONLY at the beginning of the pipeline process I began checking the code that called the pipeline using code like this.

GSAItem orderItem = (GSAItem) order.getRepositoryItem();
ItemTransactionState state = orderItem.getItemTransactionState(false);
try {
  int status = state.mGSATransaction.getTransaction().getStatus();
  if (status == Status.STATUS_MARKED_ROLLBACK) {
    logError("Oh-oh, marked for rollback.");
  }
} catch (SystemException exc) {}

I finally found the problem was that in a previous call to another pipeline an error had occurred and the transaction was marked for rollback. However the code did not check the result of the pipeline call and had continued.

The moral of the story is always check your return values and don’t go down the rat hole of believing it’s a transaction issue.

Alice in front of the rabbit hole

Fixing Resource Already Exists on Disk Errors in Eclipse

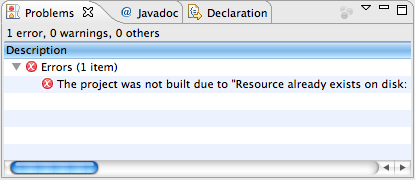
When I imported a new project I could not build it because of “Resource already exists on disk” errors like this.

Eclipse: The project was not built due to "Resource already exists on disk"

The simple fix was to remove the directory, typically classes, which contained the file it was complaining about and then refreshing. Removing just the file and then refreshing did not work.

However when I would do an ant build later and then refresh my project I would get the same error.

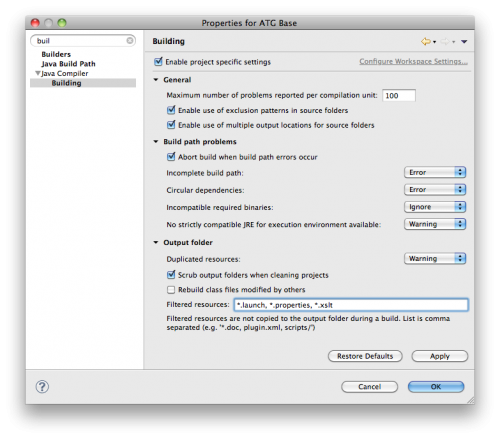
The better solution is to tell Eclipse not to copy the files it is complaining about to the output folder.

  1. Go to Project Properties.
  2. Select Java Compiler -> Building.
  3. In the Filtered resources box add the files you don’t want copied.
  4. Rebuild project.

Here is a screenshot showing how I added “*.properties, *.xslt” to the Filtered resources to fix this problem.

Eclipse: Filtered resources in Project Properties, Java Compiler, Building

Eclipse: Filtered resources in Project Properties, Java Compiler, Building

Turning On Debug in JBoss

Prius Power ButtonThere are probably many ways of turning debug on in JBoss.

In windows the way I do it is by uncommenting the line in<JBoss>/bin/run.bat that starts with:

rem set JAVA_OPTS=-Xdebug


Uncommenting in DOS bat files is simply done by removing the rem command:

set JAVA_OPTS=-Xdebug


I created aliases for turning debug on and off. I use a script which simply replaces one string with another.

alias debugon='changeString.sh "^rem set JAVA_OPTS=-Xdebug" "set JAVA_OPTS=-Xdebug" ${JBOSS}/bin/run.bat && chmod 755 ${JBOSS}/bin/run.bat && unix2dos ${JBOSS}/bin/run.bat'
alias debugoff='changeString.sh "^set JAVA_OPTS=-Xdebug" "rem set JAVA_OPTS=-Xdebug" ${JBOSS}/bin/run.bat && chmod 755 ${JBOSS}/bin/run.bat && unix2dos ${JBOSS}/bin/run.bat'


On Unix I do a similar thing, uncommenting this line in <JBoss>/bin/run.conf:

#JAVA_OPTS="$JAVA_OPTS -Xrunjdwp:transport=dt_socket,address=8787,server=y,suspend=n"


Uncommenting in Unix shell scripts is simply done by removing the # character at the beginning of the line.

JAVA_OPTS="$JAVA_OPTS -Xrunjdwp:transport=dt_socket,address=8787,server=y,suspend=n"


These are my aliases on UNIX for turning debug on and off.

alias debugon="changeString.sh '^#JAVA_OPTS=\"\$JAVA_OPTS -Xrunjdwp:transport=dt_socket' 'JAVA_OPTS=\"\$JAVA_OPTS -Xrunjdwp:transport=dt_socket' ${JBOSS_HOME}/bin/run.conf"
alias debugoff="changeString.sh '^JAVA_OPTS=\"\$JAVA_OPTS -Xrunjdwp:transport=dt_socket' '#JAVA_OPTS=\"\$JAVA_OPTS -Xrunjdwp:transport=dt_socket' ${JBOSS_HOME}/bin/run.conf"


One of the reasons I created the scripts was because on Windows suspend=y by default. Therefore when in debug mode you have to start your debugger or the JBoss server will not completely start up. On Unix suspend=n by default. If you change suspend=n on Windows too then the server will start up without waiting for the debugger to attach.

Note that you can only have one server with debug on for a given port, e.g. port 8787.  So if you try to start more than one JBoss server with that port, only the first will start.  The solution is to start only one server with debug on or start different servers with different debug ports.

Debugging WebSphere Applications with IBM Rational Application Developer

IBM Rational Application Developer (RAD) is basically a typically IBM heavy version of EclipseWebSphere is a typically IBM heavy version of a J2EE server.  Therefore you would think you could debug web applications using RAD fairly easily like you can on JBoss or ATG DAS using Eclipse.

However I could not find anyone on my latest project who knew how to do this.  Fortunately after much Googling I found this PDF document, Debugging Applications in IBM Rational Application Developer, and on page 12 are instructions on how to do this.

The instructions seem to be a little out of date so here are my instructions.

  1. Log into your Integrated Solutions Console.  The default URL is http://localhost:9060/ibm/console/login.do.
  2. Navigate using the left side column to Servers –> Application Servers.
  3. Select the Application server you want to debug from the list of Application servers.
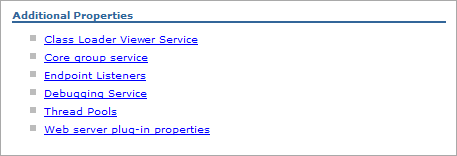
  4. Under the Configuration tab select the Debugging Service link which is near the bottom right in the Additional Properties section.

    Debugging Service link in Additional Properties section

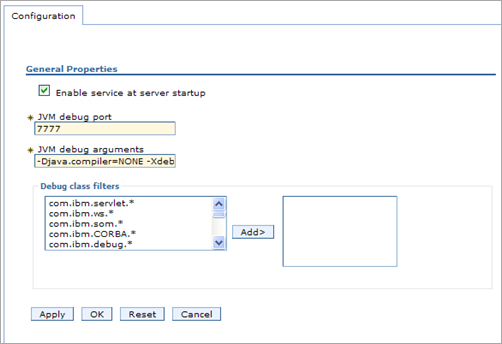
  5. Select the “Enable service at server startup” checkbox.  Note the JVM debug port.

    Debugging Service configuration

  6. Press the Apply button.
  7. In the Messages box, which appeared at the top after pressing the Apply button, click on the Save link.

    Debugging Service messages

  8. Stop and start your Application Server.  It should now be running in Debug mode.
  9. In RAD go to the project for the web application you want to debug.
  10. From the menu select Run –> Debug Configurations.
  11. Select Remote Java Application and press the New button (it’s the top left button).  For the port set it to the JVM debug port (default is 7777).
  12. Press Apply.  Then press Debug.  It should connect to WebSphere’s JVM.

Now you can set breakpoints and even change small amounts of code which will be deployed automatically to WebSphere.  No more waiting 15 minutes to test every change you make because builds are so brutally long. 🙂

ATGLogColorizer for Colorizing ATG Server Outputs and Logs

ATGLogColorizer

Color is wonderful.  With color we can immediately recognize patterns, signals, warnings, etc.  By using a utility that color codes your logs and server outputs to highlight errors in red, warnings in yellow, etc. you can be much more efficient about how you monitor and search.

Back in the day we used to use DynamoFilter.exe to color code the output of running ATG on the Dynamo Application Server (DAS).  Now that people no longer use DAS that application is no longer useful.

Today though I found out about the open source project ATGLogColorizer.  This fantastic utility works with JBoss, WebLogic, DAS and WebSphere.  It works on Windows, Mac OSX, Solaris and other UNIX variants.  It even works on Cygwin.

This is how I start JBoss with ATGLogColorizer on Cygwin.

${ATG}/home/bin/startDynamoOnJBOSS.bat -f -run-in-place -c default -m Foo | ATGLogColorizer.exe'

And this is how I start JBoss with ATGLogColorizer on Mac OS X.

${ATG}/home/bin/startDynamoOnJBOSS.sh -f -run-in-place -c default -m Foo | ATGLogColorizer_v1_2_OSX'

Life has become a little better. 🙂

For further reading please see and ATGLogColorizer and ATG Log Colorizer for JBoss.

How to Debug an InvalidVersionException from Updating an ATG Order

I thought I saw a puddy cat.... on Flickr

If you ever update an order outside of a transaction then the next time you update it within a transaction you will get the infamous, dreaded InvalidVersionException.

WARN  atg.commerce.order.ShoppingCartModifier
atg.commerce.order.InvalidVersionException: This order (o3830002) is out of date. Changes have been made to the order and the operation should be resubmitted. Order version 333, Repository item version 334.
   at atg.commerce.order.OrderManager.updateOrder(OrderManager.java:2557)

For example this could happen if you update your order in your JSP page.

<dsp:setvalue bean=”order.foo” value=”bar” />

To fix this problem you must always make sure to update an order within a transaction like this.

Transaction tr = null;
try {
  tr = ensureTransaction();
  synchronized (getOrder()) {
    getOrder().setFoo("bar");
    try {
      getOrderManager().updateOrder(order);
    }
    catch (Exception exc) {
      processException(exc, MSG_ERROR_UPDATE_ORDER, pRequest, pResponse);
    }
  }
}
finally {
  if (tr != null) commitTransaction(tr);
}

In some cases you might find a method is called within a transaction by another method and in other cases it is not.

public boolean handleFoo(DynamoHttpServletRequest req, DynamoHttpServletResponse res) {
  Transaction tr = null;
  try {
    tr = ensureTransaction();
    synchronized (getOrder()) {
      setFoo("bar");
      try {
        getOrderManager().updateOrder(order);
      }
      catch (Exception exc) {
        processException(exc, MSG_ERROR_UPDATE_ORDER, pRequest, pResponse);
      }
    }
    return checkFormRedirect(getSuccessUrl(), getErrorUrl(), req, res);
  }
  finally {
    if (tr != null) commitTransaction(tr);
  }
}

public void setFoo(String foo) {
  getOrder().setFoo(foo);
}

In the above example the handleFoo method properly updates the order within the transaction.  However calling the setFoo method directly will cause a problem since the order is not updated within a transaction.  To fix this you use the same pattern again to ensure the order is updated within a transaction.  It is okay to do this more than once during a request.

To debug this problem you can use Eclipse to make sure that wherever you update an order is always within a transaction. You can use the debugger to find which methods are called and/or you can use the call hierarchy to find out how methods are called.

Another way to help debug this is adding JSP code similar to the one I list below. It outputs the version of the order that the form handler has and the version that is in the repository.  If there is a difference then you know that the action you took before at some point updated the order outside of a transaction.

<dspel:getvalueof bean="ShoppingCartModifier.order.id" var="orderId" />
FORM HANDLER ORDER ID: ${orderId}<br/>
FORM HANDLER ORDER VERSION: <dsp:valueof bean="ShoppingCartModifier.order.version" /><br/>
<dsp:droplet name="/atg/dynamo/droplet/RQLQueryForEach">
  <dsp:param name="queryRQL" value="ID IN { \"${orderId}\" }"/>
  <dsp:param name="repository" value="/atg/commerce/order/OrderRepository"/>
  <dsp:param name="itemDescriptor" value="order"/>
  <dsp:oparam name="output">
    REPOSITORY ORDER VERSION: <dsp:valueof param="element.version"/><br/>
  </dsp:oparam>
</dsp:droplet>

For further reading please see Nabble – ATG Dynamo – Commerce Assist Returns and the Transaction Management section in the ATG Programming Guide.

How to Debug No Output for ATG ForEach

foreach

Today I added a feature in my shopping cart JSP page but nothing was showing up.  This was because the output of ATG ForEach droplet was blanks.

To debug this I did the following steps.

  1. I added an empty oparam to see if the ForEach droplet thought the collection was empty.
    <dsp:oparam="empty">Empty?</dsp:oparam>

    It did not.

  2. I outputted the count in the output oparam to see if it was looping through the collection.
    <dsp:oparam="output"><dsp:valueof param="count"/> <dsp:valueof param="element"/></dsp:oparam>

    It was looping through the collection.

  3. Finally I debugged using Eclipse the ForEach code.  The ForEach code can be found in <ATG>/DAS/src/Java/atg/droplet/ForEach.java

    Using the debugger I realized that the element name of the loop was being set to something else which is why <dsp:valueof param=”element”/> was blank.

It turned out that the ForEach droplet was inside another ForEach droplet and in that droplet they set the element name like this.

<dsp:param name="elementName" value="CommerceItem" />

By setting the elementName parameter to something else in my ForEach droplet and then referencing it properly I was finally able to get the expected output.

<dsp:droplet name="/atg/dynamo/droplet/ForEach">
 <dsp:param name="array" param="CommerceItem.auxiliaryData.productRef.dvds"/>
 <dsp:param name="elementName" value="dvd" />
 <dsp:oparam name="output">
  <dsp:valueof param="dvd.name" />
 </dsp:oparam>
</dsp:droplet>

By the way ATG documentation suggests not using elementName.

elementName and indexName allow you to provide a parameter name other than element and index, respectively. A better way to provide a different parameter name is to use the dsp:setvalue tag.

In our example we would do this instead of setting the elementName param.

 <dsp:setvalue param="dvd" paramvalue="element" />

Log SQL on ATG

Dudley Zoo Sarah the Sumatran Tiger (Life Of Pi) on FlickrDudley Zoo Sarah the Sumatran Tiger (Life Of Pi) by donebythehandsofabrokenartist

To log SQL turn on logging debug for your Repository component.

For example, set /betweengo/repository/Repository.loggingDebug to true.

Note that a lot of SQL statements are outputted. If you want to selectively turn it on and off you can put this in your JSP where you want to start logging SQL.

<dspel:setvalue bean="/betweengo/repository/Repository.loggingDebug"  value="true"/>

And then put this in your JSP where you want to stop logging SQL.

<dspel:setvalue bean="/betweengo/repository/Repository.loggingDebug"  value="false"/>

Note I think this solution only works if you are using a javax.sql.DataSource like in a JBoss configuration.

For ATG’s atg.service.jdbc.FakeXADataSource there are special properties for logging SQL.

Property Description
loggingSQLError logs SQL exceptions as errors
loggingSQLWarning logs SQL warnings received by the pool
loggingSQLInfo logs SQL statements sent by the pool
loggingSQLDebug logs JDBC method calls made by the pool

For debugging purposes most of the time you will just want to set loggingSQLInfo=true.

For further reading please see Configuring ATG Data Sources for Data Import in the ATG Installation and Configuration Guide.